How To Really Understand Statistical Significance?
Published on May 17, 2022 by Hemanth
--
Statistical significance is one of those “scientific” concepts/tools that has steadily been misused over the years (especially in the social sciences). In this essay, I aim to clarify certain fundamental misunderstandings related to this concept and its application.
We will start with an introduction to our intuitive understanding/application of statistical significance. Then, we will dive one level deeper and cover the scientific business of statistical significance. Finally, we will discuss the core issues with our current usage of statistical significance and explore potential remedies as well. Without any further ado, let us begin.
Human beings use intuitive statistical models all the time. We observe real-world events, build hypotheses over time, and then establish them as truths using our intuitive statistical models. Of course, we don’t express words like “statistical” and “significance” for such purposes. Here is a hypothetical example:
You are driving downtown and stop in front of a signal near the town square. You let out a big sigh of frustration. You do this because you know that if you get a red on this signal, then you will get a line of reds at the next four traffic signals as well. You wish that you had gotten a green instead.
What is going on here is that you have built-up a mental database of your past experiences and constructed a “If-Then” hypothesis. Then, based on further experiences (reds and greens), you have established your initial hypothesis as the truth. You won’t need to question this “truth” unless there is a sufficient frequency of events that discredit your original “If-Then” hypothesis.
In such an intuitive statistics model, any event (data) that confirms your hypothesis leads to statistical significance. This means that your intuitive statistical model gains significance or becomes more important.
Needless to say, there are a few major issues here. I have covered one of the major philosophical issues in the essay: How to really understand the raven paradox? Apart from that, there is also the fundamental issue that the scientific interpretation of statistical significance is starkly different from our institutive interpretation.
Scientific Statistical Significance
Intuition usually goes out the window when we are dealing with scientific methods. As far as scientific statistical methods are concerned, one of the pioneers of the modern method was Ronald Aylmer Fisher. The modern statistical method can be summarized by the following action-steps:
1. Frame the null-hypothesis.
2. Run an experiment and record observations/data.
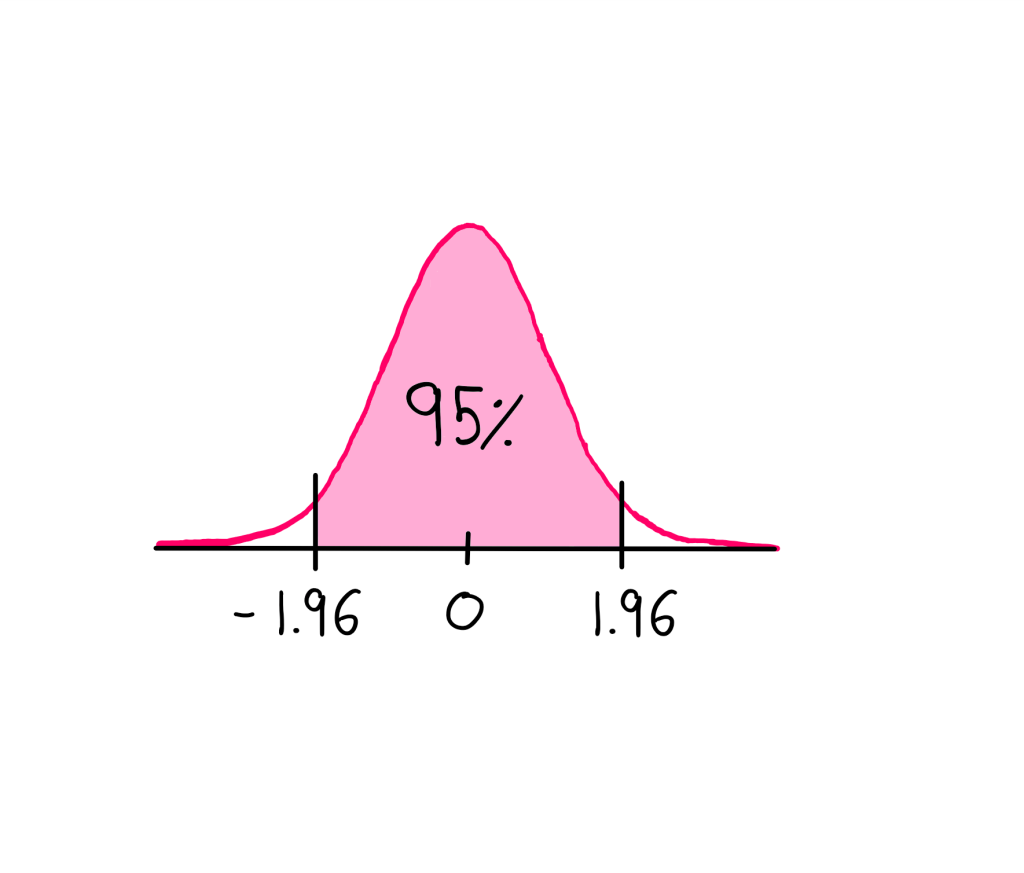
3. Calculate the probability of obtaining the observed results as exceptions (extremes) to the null-hypothesis, assuming that the null-hypothesis is true. This probability value is known in the biz as the p-value.
4. If the p-value is less than a threshold value (5% was Fisher’s favourite), it means that your experimental results reject the null-hypothesis, and consequently, are statistically significant. If the p-value is above the threshold value, then it means that the null-hypothesis has not been rejected.
The first step in the scientific method is to frame the null-hypothesis. Right here, it is important to note a fundamental difference between intuitive statistical significance and scientific statistical significance. With our intuitive mental models, when events confirm our hypothesis, we mark them as statistically significant.
With the scientific method, it is not sufficient that the data is consistent with our hypothesis. Instead, it is necessary that the data is sufficiently inconsistent with the negation of our hypothesis (null-hypothesis) for it to be considered statistically significant.
If all this is too abstract for you, let me help you out with an example. Let’s say that I claim that I have the power to make the sun rise in the east. With your intuitive model, if you keep testing the hypothesis by observing sunrises, the data would appear to have (intuitive) statistical significance.
Instead, if you follow the scientific method, the null-hypothesis would be: I do not have the power to make the sun rise in the east (negation of the original statement). Once you have the null-hypothesis, assuming that it is true, you could test it by asking me not to make the sun rise in the east. If I cannot pull this off, the null-hypothesis is not ruled out.
A More Practical Example
Say that you are developing a cream to shield people from radio waves and wish to test it for statistical significance. You are operating under the hypothesis that the cream is going to shield people from radio waves in a statistically significant way.
The corresponding null hypothesis would be: the cream has no effect on human beings. In order to put your null hypothesis to test, you conduct an experiment with 100 people. 50 of these people are given your cream and 50 of them are given a placebo cream. You then measure for radio wave-shielding numbers for all 100.
It is not just sufficient that more cream-people show better shield-numbers than placebo-people. It is also necessary that lesser than a threshold number of placebo people show better or comparable shield-numbers than the cream people (backed by the p-value). If this is the case, then we could call the results of the experiment statistically significant (that is, the null hypothesis is rejected).
I have cut corners with this example by not going into probabilities of natural shielding, assumed distributions, etc. But for the purposes of this essay, this example suffices.
Now that we have covered the scientific method of null-hypothesis significance testing pioneered by R.A. Fisher, let us jump into the issues with this approach.
Issues with Statistical Significance
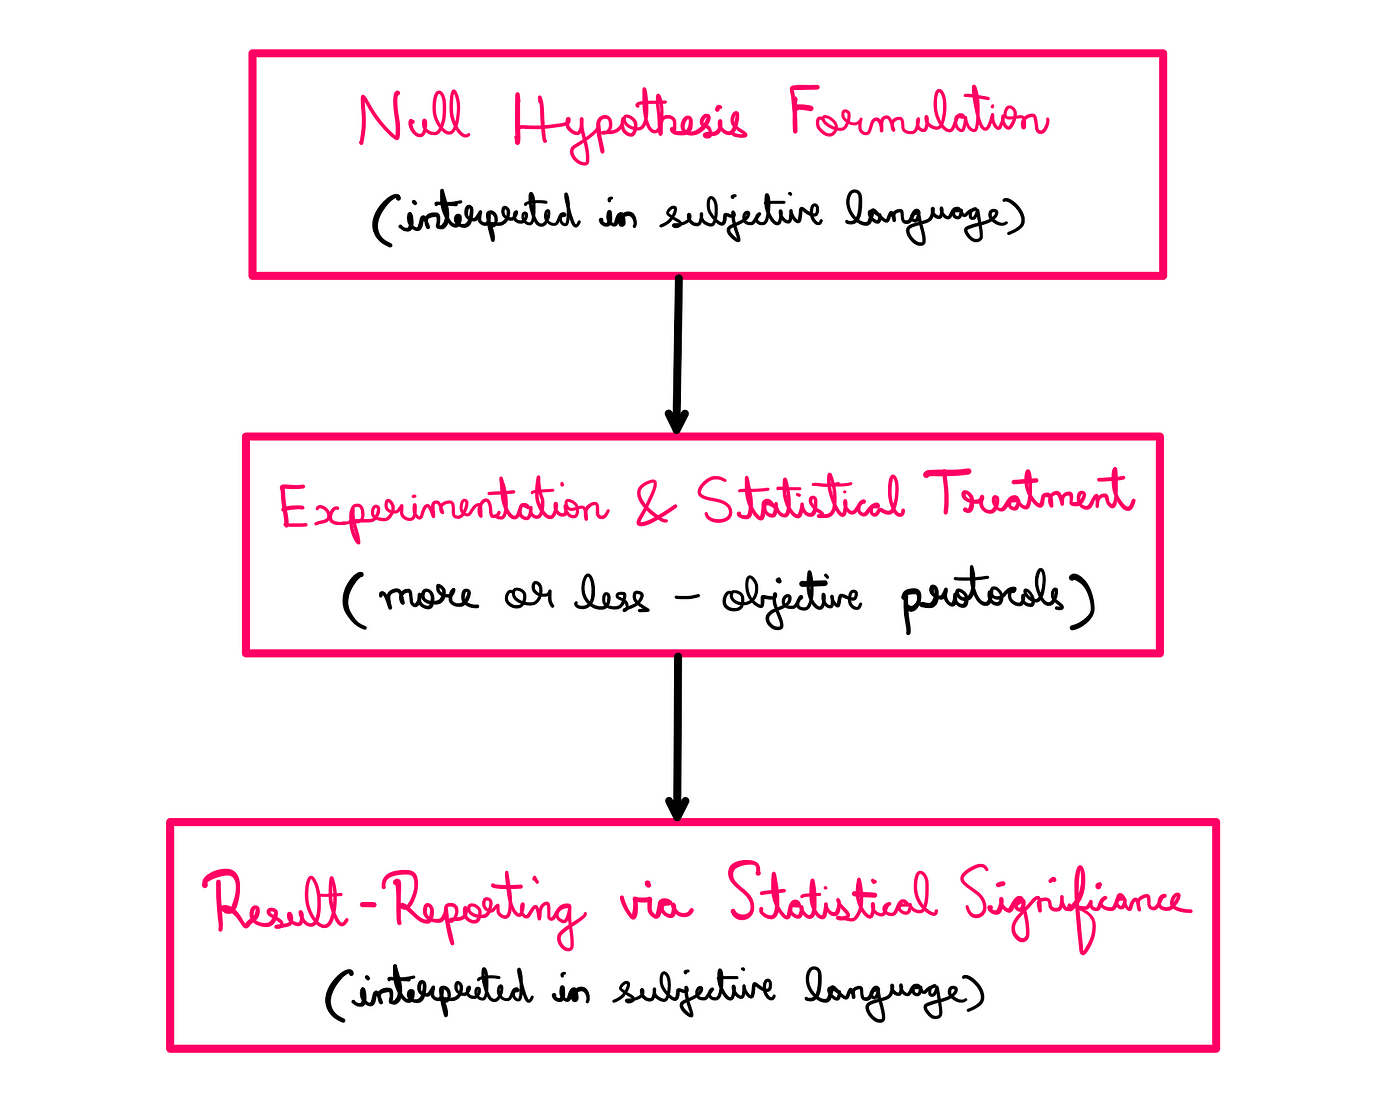
The majority of the issues that we face occur at what I call interface points (more on that in a bit). A typical statistical workflow looks as follows:
Statistical Workflow — Flowchart created by the author
As you can see, the experimentation and statistical treatment of the problem at hand are pretty much objective protocols. However, there are issues that creep in when we formulate our null-hypothesis and when we interpret results from statistical significance.
The First Interface Point
Because we interpret the null hypothesis via human language, it does not occur to us that the null-hypothesis is practically almost always false. There is no practical way that the cream has no effect on human beings. It either improves radio wave-shielding or makes it worse. In this sense, almost every application has a binary outcome: either it helps or it doesn’t. The zero-effect application might very well not exist.
It’s just that when the effects are very small, we practically consider them as zero. The formulation of the null-hypothesis is what I call as the first interface point. This is partly where our issues emerge from; poor formulation leads to poor results.
The Second Interface Point
The second interface point occurs when we interpret the statistical results. You see, all that statistical significance (in the scientific sense) tells us is that there is an effect from the cream on human beings. Contrary to our intuition, it does not tell us anything about “significance” or “importance” of the results.
It is up to us to draw conclusions from the “statistically significant” results. We usually do this via subjective language as well. If our subjective conclusions are misleading, the scientific concept of “statistical significance” becomes arbitrarily misleading as well.
Imagine a situation where I state that the radio wave-shielding cream improves the shielding as much as 10 times compared to no cream. That sounds very convincing.
But what if I revealed that the shielding number without the cream was 0.0000000000001 with 100 being the highest possible and 0 being the lowest possible values when health factors are all held equal. This would mean that the number with the cream was 0.0000000000010 — that is not so convincing!
How to Treat the Issues with Statistical Significance
Inorder to start addressing the issues we have discussed so far, we need to focus on the interface points first. There is no silver bullet solution for these issues.
Whenever we are presented with “statistically significant” results, we need to critically analyse the formulation of the null hypothesis and the linguistic interpretation of “statistical significance” first.
Don’t get me wrong. There could be issues with the statistical methods as well. But even before we get to that part, the interface points present a more annoying problem — they play with human emotions. For instance, a scary-sounding conclusion/interpretation could invoke an unwarranted response from people (ten times a very, very small number is still a very small number).
To conclude, the term “statistical significance” says nothing about the quantitative significance of the results. All it says is that we are detecting something worth our attention.
We use cookies on our website to give you the most relevant experience by remembering your preferences and repeat visits. By clicking “Accept”, you consent to the use of ALL the cookies.
This website uses cookies to improve your experience while you navigate through the website. Out of these, the cookies that are categorized as necessary are stored on your browser as they are essential for the working of basic functionalities of the website. We also use third-party cookies that help us analyze and understand how you use this website. These cookies will be stored in your browser only with your consent. You also have the option to opt-out of these cookies. But opting out of some of these cookies may affect your browsing experience.
Necessary cookies are absolutely essential for the website to function properly. These cookies ensure basic functionalities and security features of the website, anonymously.
Cookie
Duration
Description
cookielawinfo-checkbox-advertisement
1 year
Set by the GDPR Cookie Consent plugin, this cookie is used to record the user consent for the cookies in the "Advertisement" category .
cookielawinfo-checkbox-analytics
11 months
This cookie is set by GDPR Cookie Consent plugin. The cookie is used to store the user consent for the cookies in the category "Analytics".
cookielawinfo-checkbox-functional
11 months
The cookie is set by GDPR cookie consent to record the user consent for the cookies in the category "Functional".
cookielawinfo-checkbox-necessary
11 months
This cookie is set by GDPR Cookie Consent plugin. The cookies is used to store the user consent for the cookies in the category "Necessary".
cookielawinfo-checkbox-others
11 months
This cookie is set by GDPR Cookie Consent plugin. The cookie is used to store the user consent for the cookies in the category "Other.
cookielawinfo-checkbox-performance
11 months
This cookie is set by GDPR Cookie Consent plugin. The cookie is used to store the user consent for the cookies in the category "Performance".
CookieLawInfoConsent
1 year
Records the default button state of the corresponding category & the status of CCPA. It works only in coordination with the primary cookie.
viewed_cookie_policy
11 months
The cookie is set by the GDPR Cookie Consent plugin and is used to store whether or not user has consented to the use of cookies. It does not store any personal data.
Functional cookies help to perform certain functionalities like sharing the content of the website on social media platforms, collect feedbacks, and other third-party features.
Performance cookies are used to understand and analyze the key performance indexes of the website which helps in delivering a better user experience for the visitors.
Cookie
Duration
Description
_gat
1 minute
This cookie is installed by Google Universal Analytics to restrain request rate and thus limit the collection of data on high traffic sites.
Analytical cookies are used to understand how visitors interact with the website. These cookies help provide information on metrics the number of visitors, bounce rate, traffic source, etc.
Cookie
Duration
Description
__gads
1 year 24 days
The __gads cookie, set by Google, is stored under DoubleClick domain and tracks the number of times users see an advert, measures the success of the campaign and calculates its revenue. This cookie can only be read from the domain they are set on and will not track any data while browsing through other sites.
_ga
2 years
The _ga cookie, installed by Google Analytics, calculates visitor, session and campaign data and also keeps track of site usage for the site's analytics report. The cookie stores information anonymously and assigns a randomly generated number to recognize unique visitors.
_ga_R5WSNS3HKS
2 years
This cookie is installed by Google Analytics.
_gat_gtag_UA_131795354_1
1 minute
Set by Google to distinguish users.
_gid
1 day
Installed by Google Analytics, _gid cookie stores information on how visitors use a website, while also creating an analytics report of the website's performance. Some of the data that are collected include the number of visitors, their source, and the pages they visit anonymously.
CONSENT
2 years
YouTube sets this cookie via embedded youtube-videos and registers anonymous statistical data.
Advertisement cookies are used to provide visitors with relevant ads and marketing campaigns. These cookies track visitors across websites and collect information to provide customized ads.
Cookie
Duration
Description
IDE
1 year 24 days
Google DoubleClick IDE cookies are used to store information about how the user uses the website to present them with relevant ads and according to the user profile.
test_cookie
15 minutes
The test_cookie is set by doubleclick.net and is used to determine if the user's browser supports cookies.
VISITOR_INFO1_LIVE
5 months 27 days
A cookie set by YouTube to measure bandwidth that determines whether the user gets the new or old player interface.
YSC
session
YSC cookie is set by Youtube and is used to track the views of embedded videos on Youtube pages.
yt-remote-connected-devices
never
YouTube sets this cookie to store the video preferences of the user using embedded YouTube video.
yt-remote-device-id
never
YouTube sets this cookie to store the video preferences of the user using embedded YouTube video.

Comments