Unpopular Candidates Win Elections. How? Here Is The Math.
Published on December 6, 2022 by Hemanth
--
If you have been following politics long enough, it would not surprise you that unpopular candidates win elections now and then. But what might surprise you is the fact that mathematics can explain this phenomenon quite deterministically.
The underlying effect here is known as the Asymmetric Dominance Effect. I have already written a layman-friendly non-technical essay on this topic; a precursor to this essay. So, if you are interested, check it out.
In this essay, I will be illustrating the mathematics behind the asymmetric dominance effect using a simplified (yet realistic) example. Following this, I will also go on to demonstrate a mathematical approach that one could use to neutralize the asymmetric dominance effect. Let us begin.
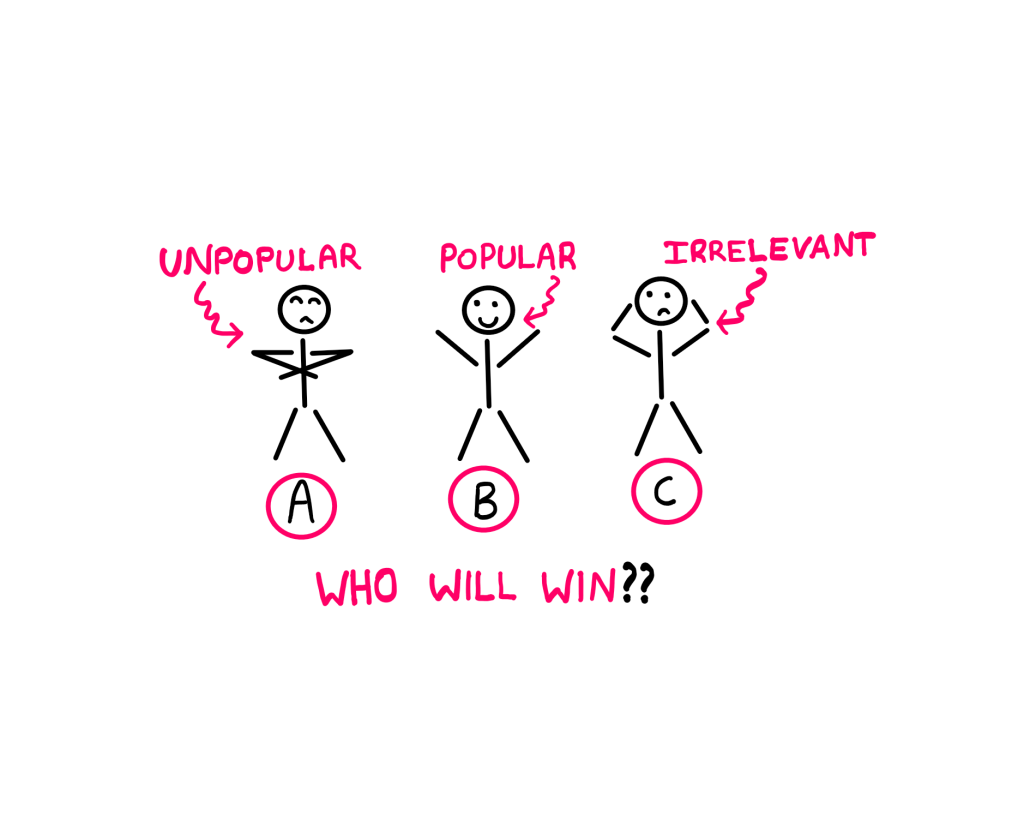
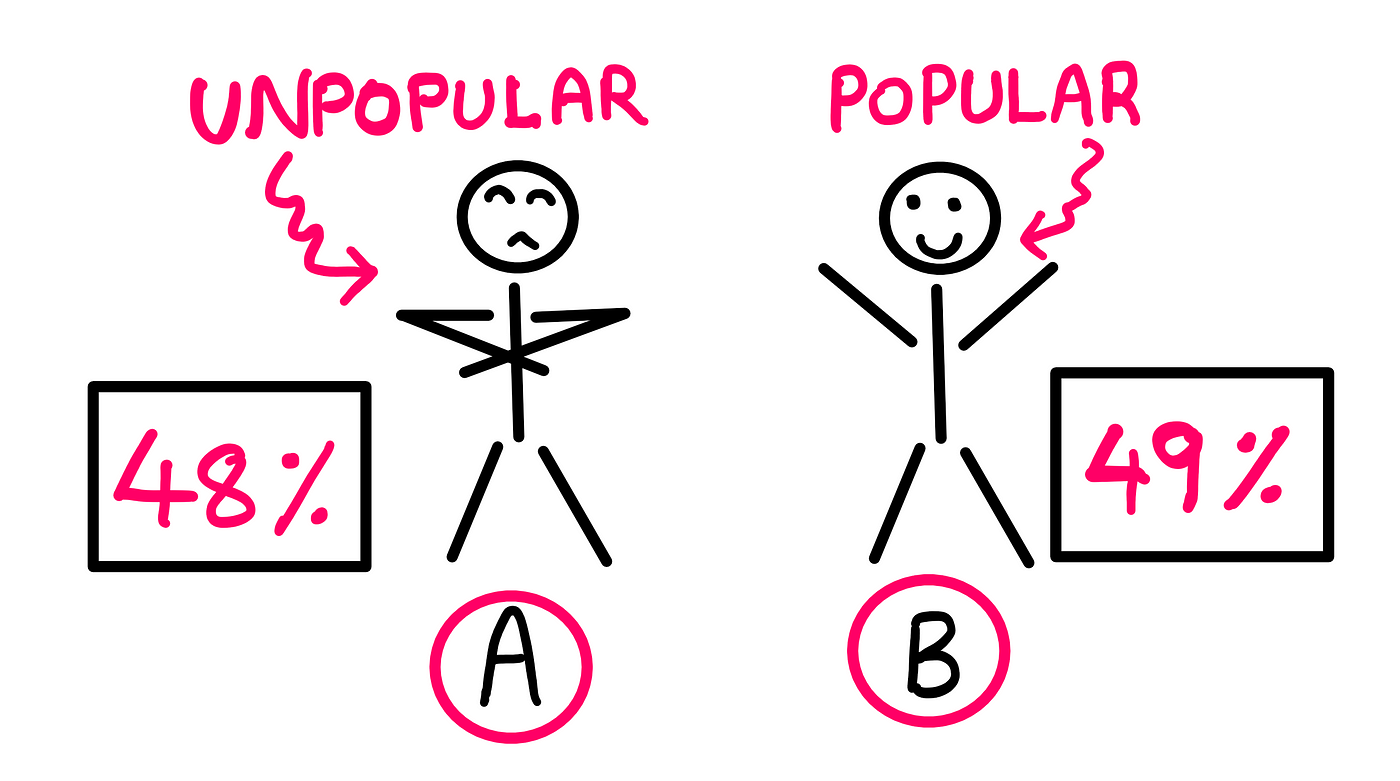
Let us consider a hypothetical election scenario involving two candidates: A and B in the town of Mathville. You see, 48% of the folks in Mathville like candidate A, whereas 49% of the folks like candidate B.
Candidates A and B — Illustrative art created by the author
So, in a head-to-head election between these two candidates, you could expect candidate B to win. So far, so good. But just like how there are minority political parties in the real world, there exists a seemingly irrelevant underdog candidate: C in Mathville as well. 3% of the folks like this candidate.
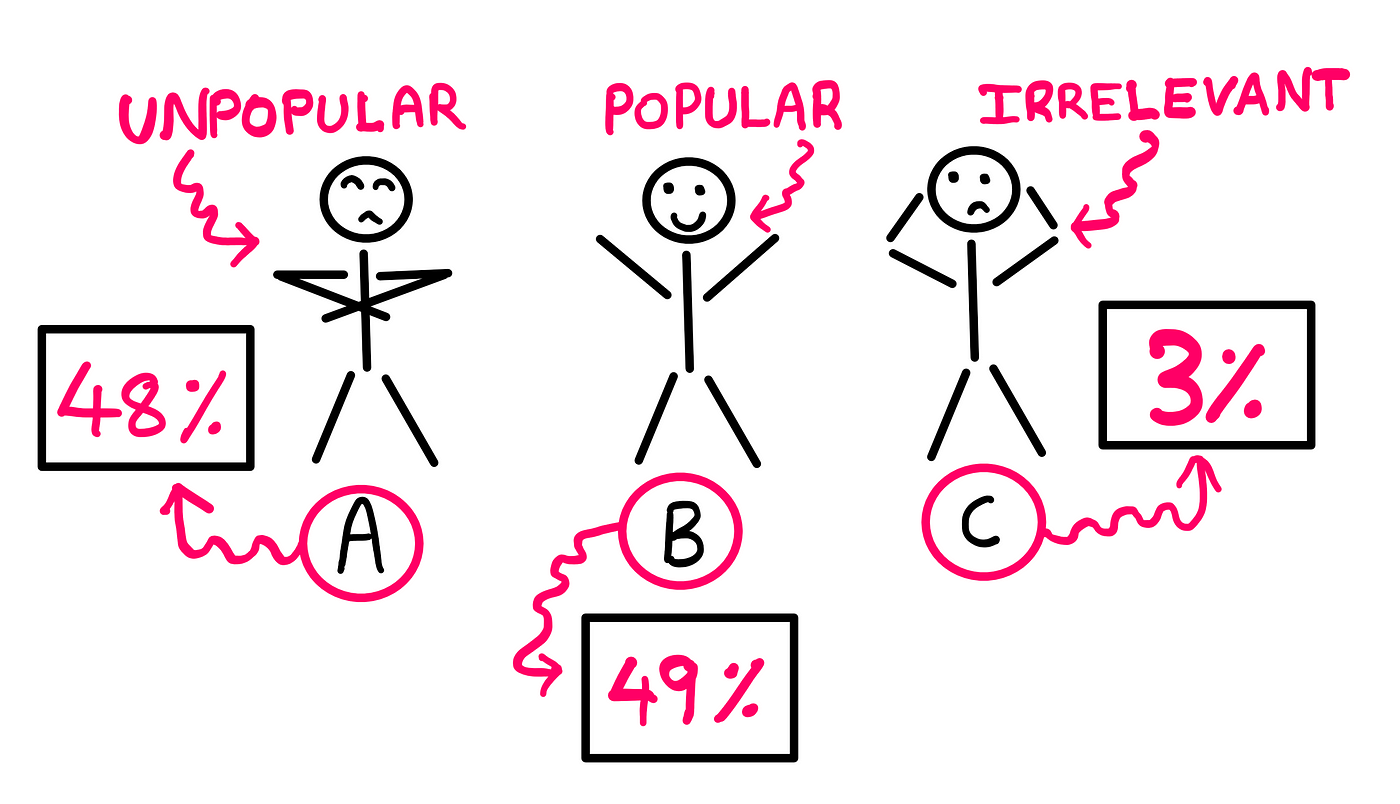
Candidate C joins A and B — Illustrative art created by the author
In an election involving these three candidates, you could expect candidate B to still win over candidate A by a slim margin and candidate C to secure the minority of the votes. But in the election that took place in Mathville, candidate A actually got 49% of the votes, whereas candidate B got 48% of the votes and candidate C got 3% of the votes.
So, in essence, the unpopular candidate won the election just after we added a seemingly irrelevant underdog candidate to the mix. That’s interesting, isn’t it? Let us find out what is going on underneath this strange phenomenon.
The Asymmetric Dominance Effect in Full Swing
Before we even start analysing the problem, let us make one thing clear. Candidate C was never going to win the election. You know that; I know that; everybody in Mathville probably knows that. Why this fact is important for us is as follows:
When the people of Mathville voted, they were collectively answering the question of:
“Should candidate A win or candidate B win?”
and NOT
“Should candidate A or B or C win?”
What is going on here is that the presence of the irrelevant alternative C somehow skewed the election in candidate A’s favour, even though the majority liked candidate B. This is the asymmetric dominance effect in full swing.
You will shortly see (mathematically), how votes involving more than two candidates can produce paradoxical outcomes. The irrelevant alternative actually plays a key role, and the majority does not always win. There exists an ambiguity as to how this is possible because we are asking the wrong question.
The Math Behind the Asymmetric Dominance Effect
The question we are asking is binary in nature: yes or no; either/or. If most people prefer a candidate and that candidate loses, then we have to look at our voting system. If we look at our current system carefully, we could arrive at this very important observation:
Our voting system does not allow for people who voted for candidate C to express their preference of candidate B over A or vice-versa.
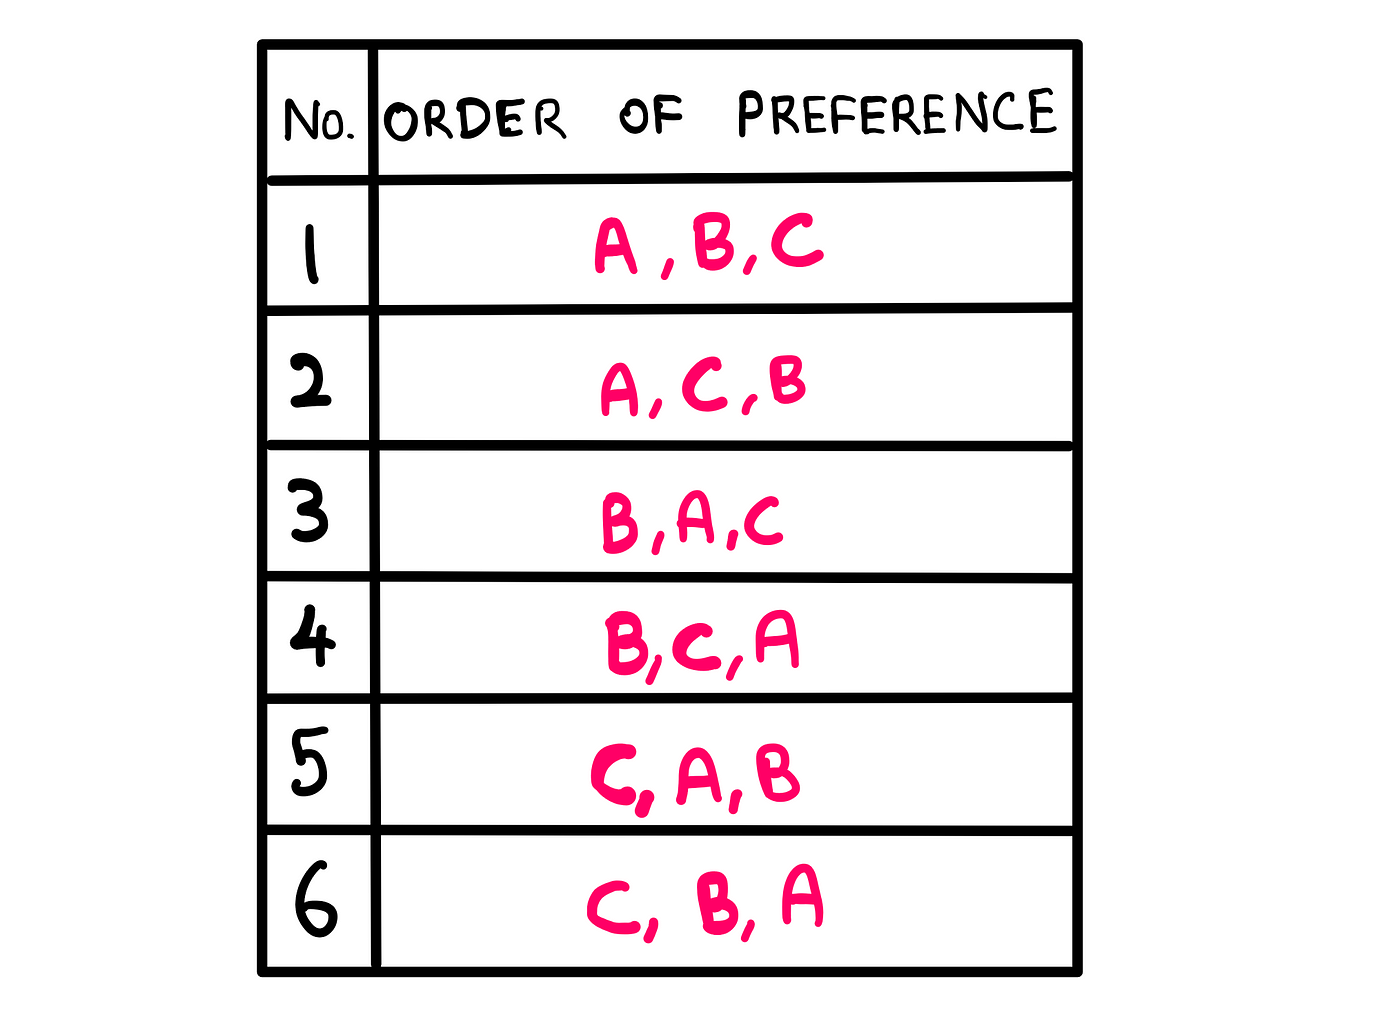
In other words, the system neglects relevant and decisive information before the final result. If this is too abstract for you, let me help you out graphically. Consider a different voting system, where the people don’t vote for a candidate binarily, but instead, express their order of preference of the available candidates as follows:
Ranking combinations — Table created by the author
Now, if we were to conduct the election using this new system in Mathville, we would get a result similar to the following distribution:
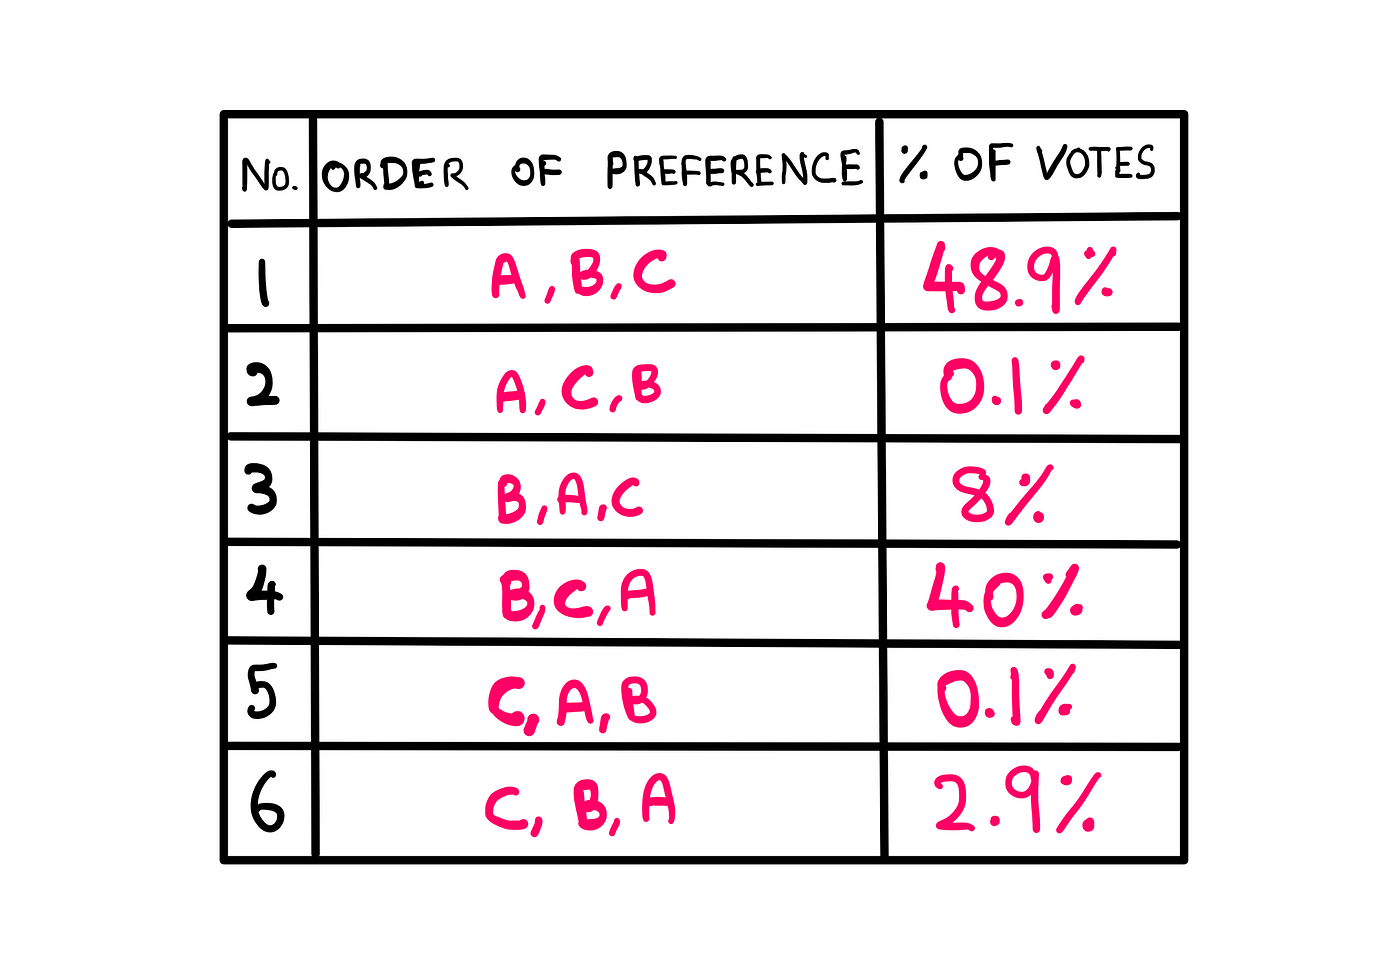
Ranking combinations with vote percentage — Table created by the author
Now, our previous voting system considers only the first preference. If you tally the percentages based on just the first ranked candidates, you would get exactly the same result as before. But with the new system, we have more information.
Using this to our advantage, pay attention to all of the ranking combinations in which candidate B comes in front of candidate A. That would be combinations 3, 4, and 6. Now, add these percentages together and you will get a total of 50.9%. This means that 49.1% of people prefer candidate A (100–50.9 = 49.1%).
In other words, the majority of the folks of Mathville prefer candidate B, but candidate A wins because we only consider each voter’s first preference. By doing this, we let the irrelevant alternative (candidate C) skew the election in candidate A’s favour.
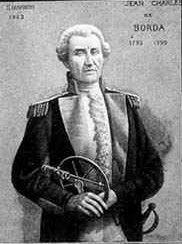
Now that we have identified what the issue is, how can we solve this? Well, it turns out that this is an already solved problem, and we have eighteenth-century French mathematician, Jean-Charles de Borda to thank for that.
Unpopular Candidates Win Elections. Applied Math Can Prevents This.
Borda’s approach treats the election as an input-output-machine. We feed in individual voters’ preferences and expect the public’s will as output in return. We could add a few layers of abstraction that consider all of the information, unlike our previous system. Let us see how.
A portrait of Jean-Charles de Borda — Image from WikiCC
First, let us consider the same distribution (from before) based on voter ranking as follows:
Ranking combinations with vote percentage — Table created by the author
Next, as per Borda’s simple and beautiful system, we can award each candidate points as per their placement in the rankings. The rules of this approach are as follows:
1. For each ranking combination, award 2 points for the first place, 1 point for the second place, and 0 points for the third place.
2. Next, multiply the number of points per candidate for each combination by the respective fraction of total voters who chose the combination.
3. Finally, sum up the products for each combination to arrive at the Borda count for each candidate.
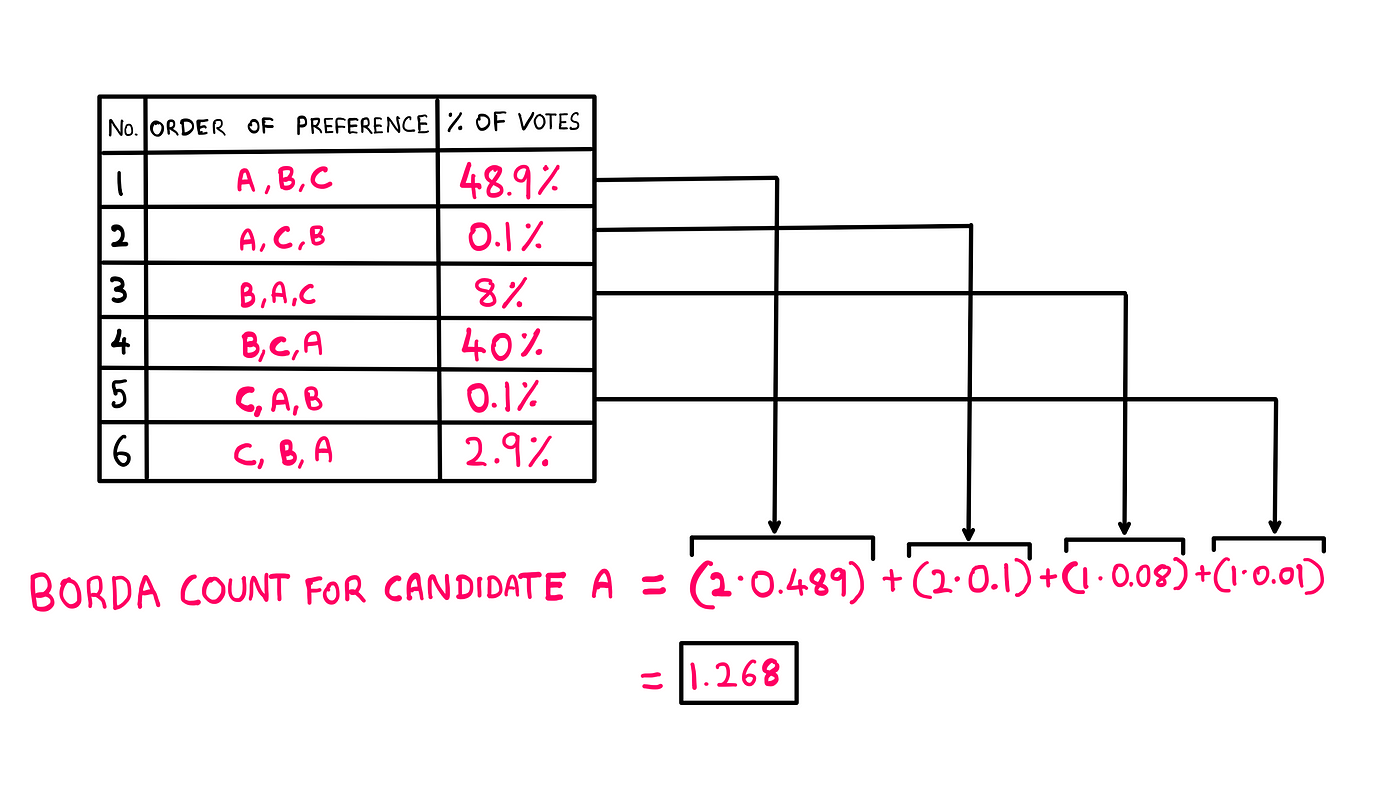
For example, based on the above distribution, we would compute the Borda count for candidate A as follows:
Borda Count for candidate A — Math illustrated by the author
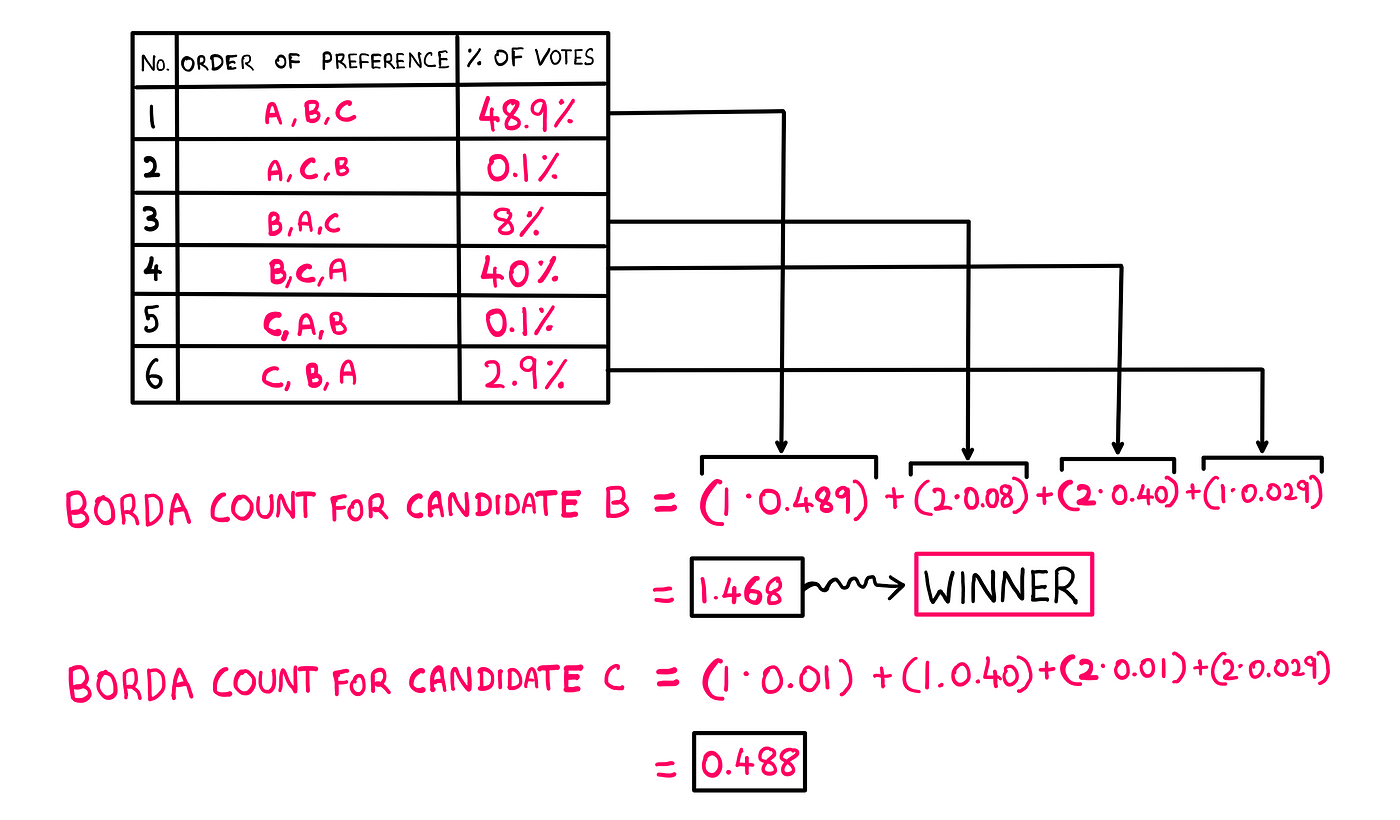
Similarly, we could compute the Borda count for the other two candidates as follows:
Borda Count for candidates B and C — Math illustrated by the author
There we go. Based on the Borda count, we no longer have a paradoxical election result, and candidate B would win the election!
Final Comments
Borda came up with his system in the year 1770. The French Academy of Sciences used his system to elect its members for two whole decades before Napoleon Bonaparte became the president and “opted” to use his own system instead.
Voting systems are never straightforward. In fact, the very notion of “public opinion” might not even exist. I have covered this issue in detail in my essay on why polls mislead most of the time. If you are interested, check it out.
When it comes to the level of complexity of today’s elections, I am not sure how practical it would be to implement the Borda count system. However, as things are, unpopular candidates win now and then, and the asymmetric dominance effect is clearly in play.
We use cookies on our website to give you the most relevant experience by remembering your preferences and repeat visits. By clicking “Accept”, you consent to the use of ALL the cookies.
This website uses cookies to improve your experience while you navigate through the website. Out of these, the cookies that are categorized as necessary are stored on your browser as they are essential for the working of basic functionalities of the website. We also use third-party cookies that help us analyze and understand how you use this website. These cookies will be stored in your browser only with your consent. You also have the option to opt-out of these cookies. But opting out of some of these cookies may affect your browsing experience.
Necessary cookies are absolutely essential for the website to function properly. These cookies ensure basic functionalities and security features of the website, anonymously.
Cookie
Duration
Description
cookielawinfo-checkbox-advertisement
1 year
Set by the GDPR Cookie Consent plugin, this cookie is used to record the user consent for the cookies in the "Advertisement" category .
cookielawinfo-checkbox-analytics
11 months
This cookie is set by GDPR Cookie Consent plugin. The cookie is used to store the user consent for the cookies in the category "Analytics".
cookielawinfo-checkbox-functional
11 months
The cookie is set by GDPR cookie consent to record the user consent for the cookies in the category "Functional".
cookielawinfo-checkbox-necessary
11 months
This cookie is set by GDPR Cookie Consent plugin. The cookies is used to store the user consent for the cookies in the category "Necessary".
cookielawinfo-checkbox-others
11 months
This cookie is set by GDPR Cookie Consent plugin. The cookie is used to store the user consent for the cookies in the category "Other.
cookielawinfo-checkbox-performance
11 months
This cookie is set by GDPR Cookie Consent plugin. The cookie is used to store the user consent for the cookies in the category "Performance".
CookieLawInfoConsent
1 year
Records the default button state of the corresponding category & the status of CCPA. It works only in coordination with the primary cookie.
viewed_cookie_policy
11 months
The cookie is set by the GDPR Cookie Consent plugin and is used to store whether or not user has consented to the use of cookies. It does not store any personal data.
Functional cookies help to perform certain functionalities like sharing the content of the website on social media platforms, collect feedbacks, and other third-party features.
Performance cookies are used to understand and analyze the key performance indexes of the website which helps in delivering a better user experience for the visitors.
Cookie
Duration
Description
_gat
1 minute
This cookie is installed by Google Universal Analytics to restrain request rate and thus limit the collection of data on high traffic sites.
Analytical cookies are used to understand how visitors interact with the website. These cookies help provide information on metrics the number of visitors, bounce rate, traffic source, etc.
Cookie
Duration
Description
__gads
1 year 24 days
The __gads cookie, set by Google, is stored under DoubleClick domain and tracks the number of times users see an advert, measures the success of the campaign and calculates its revenue. This cookie can only be read from the domain they are set on and will not track any data while browsing through other sites.
_ga
2 years
The _ga cookie, installed by Google Analytics, calculates visitor, session and campaign data and also keeps track of site usage for the site's analytics report. The cookie stores information anonymously and assigns a randomly generated number to recognize unique visitors.
_ga_R5WSNS3HKS
2 years
This cookie is installed by Google Analytics.
_gat_gtag_UA_131795354_1
1 minute
Set by Google to distinguish users.
_gid
1 day
Installed by Google Analytics, _gid cookie stores information on how visitors use a website, while also creating an analytics report of the website's performance. Some of the data that are collected include the number of visitors, their source, and the pages they visit anonymously.
CONSENT
2 years
YouTube sets this cookie via embedded youtube-videos and registers anonymous statistical data.
Advertisement cookies are used to provide visitors with relevant ads and marketing campaigns. These cookies track visitors across websites and collect information to provide customized ads.
Cookie
Duration
Description
IDE
1 year 24 days
Google DoubleClick IDE cookies are used to store information about how the user uses the website to present them with relevant ads and according to the user profile.
test_cookie
15 minutes
The test_cookie is set by doubleclick.net and is used to determine if the user's browser supports cookies.
VISITOR_INFO1_LIVE
5 months 27 days
A cookie set by YouTube to measure bandwidth that determines whether the user gets the new or old player interface.
YSC
session
YSC cookie is set by Youtube and is used to track the views of embedded videos on Youtube pages.
yt-remote-connected-devices
never
YouTube sets this cookie to store the video preferences of the user using embedded YouTube video.
yt-remote-device-id
never
YouTube sets this cookie to store the video preferences of the user using embedded YouTube video.

Comments