The Bell Curve Performance Review System Is Actually Flawed
Published on May 12, 2022 by Hemanth
--
The Bell Curve performance review system is one of the most prominently used systems in the corporate world. Every year, around the time organizational performance figures are released, the process begins. Most managers hate it; almost all employees dread it; the HR departments prepare for chaos. The yearly performance review begins.
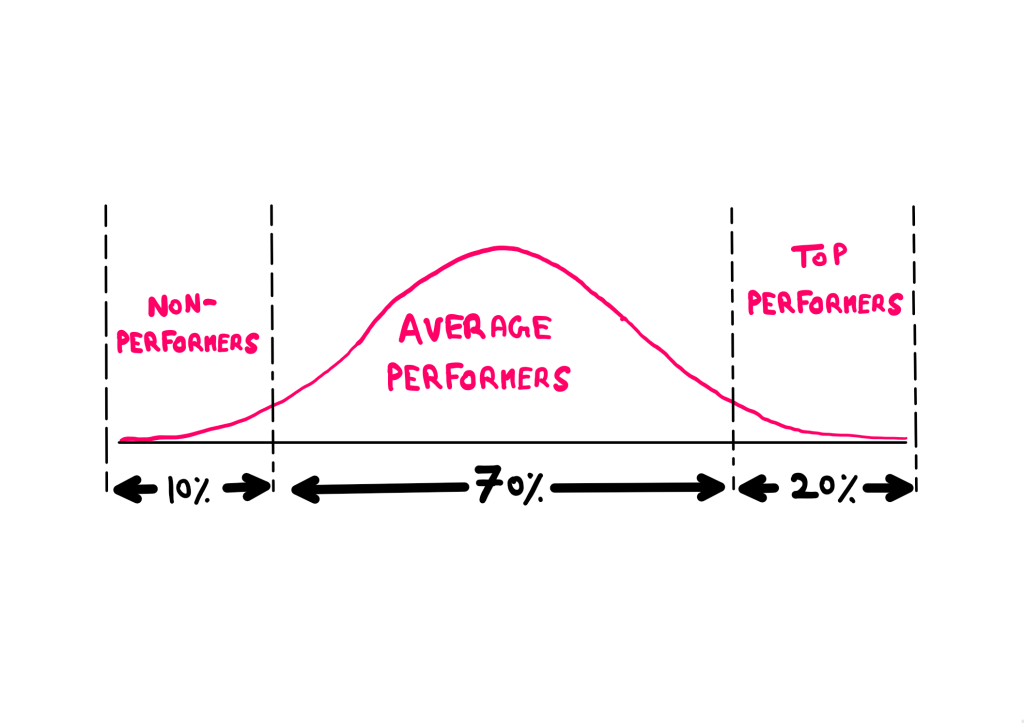
Under the bell curve performance review system, managers try to “fit” their underlings as data points in a standardized bell curve. The idea is to classify top performers, average performers, and non-performers and reward/punish them accordingly.
In this essay, I will be covering both scientific flaws as well as moral issues associated with such a system. Let us begin by tracing this review system back to its roots.
The Roots of the Bell Curve Performance Review System
The term “Bell” curve comes from the characteristic shape that a typical normal distribution features. Such a curve features the majority of the data points around the centre, while the outliers tend to flatten out towards the boundaries. Thus, the curve gets its characteristic bell-like appearance.
Way back in the 17th century, Galileo Galilei was dealing with astronomical phenomena. As he was trying to understand errors in astronomical measures, he noticed that smaller errors occurred more frequently than larger errors. Furthermore, he also noticed that the occurrence errors were symmetrical.
Fast forward to the early 19th century, Robert Adrain (in 1808) and Carl Friedrich Gauss (in 1809) independently described this behaviour mathematically. This came to be known as the mathematical formulation of normal distribution.
Not only did this apply to errors of astronomical measures, but also many other natural phenomena such as the height/weight of human beings, shoe sizes, gambling outcomes (coin tosses/dice), etc.
All this is fine, but what does this have to do with performance review systems in the corporate world?
Cue in Jack Welch
Legendary CEO Jack Welch of General Electric pioneered the bell curve performance review model for his company. For this purpose, the company modelled and tracked employee performance metrics as random variables that were normally distributed.
According to Jack, a company would broadly have 20% ‘A’ players, 70% ‘B’ players, and 10% ‘C’ players. ‘A’ players would be the best of the lot and contribute to (disproportionately) the majority of the company’s performance.
‘B’ players would be the majority of the employees. Jack considered these people indispensable for the company’s day-to-day operation. Furthermore, he wanted his ‘B’ players to look at what they were missing to become ‘A’ players and work on those areas.
The ‘C’ players would be the non-performing minority. They would not get work done and would cost the organization resources. According to Jack, these people should be fired from the organization (which is how things played out as well).
For anyone who practices scientific thinking, such an approach would invoke scepticism, as it did with me. Having covered the premise behind the bell curve performance review model, let us start by asking some critical questions about this approach.
The Bell Curve Performance Review System in the Hot Seat
Tostart, I would like to explicitly state that there is a potential morality concern lingering here as well. We will eventually get to that. But first, let us just try to look at the process objectively.
Let us say that you start using the normal distribution-based bell curve performance review model for your company starting an arbitrary year. After the first year, you reward your ‘A’ players and ‘B’ players according to a weighted benefit system, and fire your ‘C’ players (bottom 10% of the distribution).
Suppose that you repeat the process for the next five years, firing the bottom 10% each time around. Furthermore, each year, say that you hire an equivalent number of employees to the fired 10%.
You execute your hiring process with the aiming of rejecting potential ‘C’ players (from your experience and analytics). By following such a process, part of current year’s ‘B’ players and ‘A’ players have to necessarily land into the bottom 10% for the next year.
What this also means is that each year, you are shifting the median towards the right (of the normal distribution). In other words, you are implicitly assuming that the performance variables don’t have any ceiling.
In such an ideal world, this year’s mediocre (or best) will be next year’s worst (or mediocre); your company’s workforce will get more and more skilled by the year, and your company will be the market-dominating-juggernaut in just a handful of years.
The Harsh Reality Beckons
Alas! this is not the reality we live in. Remember that Galileo noted that smaller errors of astronomical measurements occurred more frequently than larger ones?
This has to do with an innate property of the normal distribution, where the deviations are not typically large. As an analogy, imagine killing off the shortest 10% of all human beings in the hope that this process will somehow help humanity get taller and taller beyond the skyscrapers in just a few years.
That won’t work, will it? Normally distributed variables have ceiling forces that limit large deviations. If they didn’t, they would not be normally distributed (per definition).
Could it be that Jack Welch implicitly assumed a non-normal distribution for his company growth that allows for, say, boundless multiplicative growth?
If so, why would he have based his performance review model based on a normal distribution? If you smell something self-contradictory here, you are not alone. There is one more subtle clue about what is going on in how Jack defines his ‘A’ players.
Jack’s ‘A’ players are (disproportionately) responsible for the majority of the company’s performance.
You see, normally distributed random variables do not exhibit this property (again, by definition). We associate such behaviour typically with power law distributions.
Cue in Ernest O’Boyle Jr. and Herman Aguinis
These two gentlemen asked a very fundamental question:
Are organizational (individual) performance metrics normally distributed?
To arrive at an answer, they conducted an extensive analysis involving 5 studies and 198 samples including 633,263 researchers, entertainers, politicians, and athletes. What they established at the end of all this effort is that organizational performance metrics do not follow a normal distribution. Instead, they follow a power law distribution known as the Paretian distribution (named after Vilfredo Pareto). I will be linking this paper for your reference at the end of this essay.
“An additional implication (of) our findings is that ordinary least squares regression, ANOVA, structural equation modeling, meta-analysis, and all techniques that provide accurate estimates only under a normal distribution assumption should not be used when the research question involves individual performance output.”
– E. O’Boyle Jr. and H. Aguinis
Power Law Dynamics
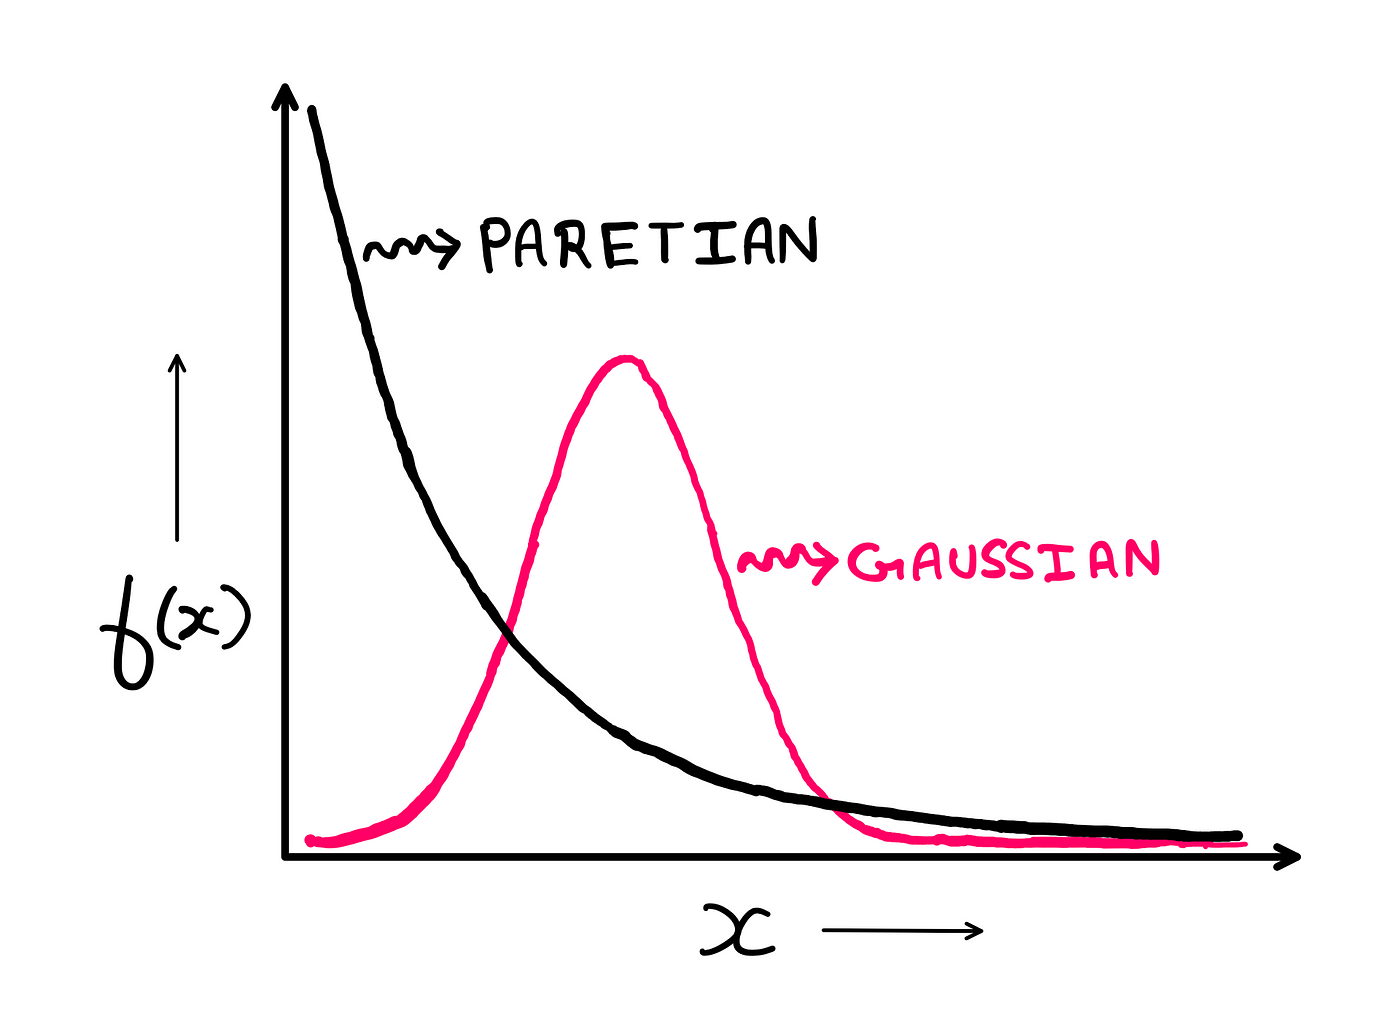
In the image below, you can see the illustration of a Paretian distribution overlaid on top of a normal distribution. When we try and beat Paretian data to fit a normal distribution, erroneous results occur.
The Paretian distribution overlaid on top of the Gaussian distribution — illustration created by the author
For instance, the authors of the study (E. O’Boyle Jr. and H. Aguinis) note that for a sample size of 25006 scholars, a Gaussian distribution would predict a total of roughly 35 top performers. But their actual data revealed that there was a total of 460 top performers. In other words, the Gaussian massively underestimates outliers.
This illustration is a classic example of how a power law distribution differentiates itself from the normal distribution — the tail numbers are significantly more pronounced and significantly more unpredictable.
Further Complications with Random Variables
If we assume that individual performance metrics follow a Paretian distribution, then we have another challenge. We know for sure that the outliers (in both extremes — over-performers and under-performers) would be more pronounced (as compared to a normal distribution). But we cannot predict with certainty which individuals will make it to the tail at any given instance (of yearly reviews).
Here’s an analogy of this dynamic in action: we know for sure that the richest person in the world will be rich by a significantly disproportionate margin as compared to the average middle-class person. But we cannot say with certainty that today’s richest person will be rich tomorrow. Yesterday, it was Bill Gates. Today, it is Elon Musk. Tomorrow, we don’t know!
If we choose to fire today’s bottom 10%, we might be firing part of tomorrow’s top 10%. We just don’t know (treating employee metrics as purely random variables).
Treating Moral Issues behind the Bell Curve Performance Review System
With the risk of stating the obvious, I dare to mention that firing/punishing low-performers induces a fear-driven performance culture in an organization. Furthermore, it breeds a gamified environment where real creativity and productivity take the back seat while people who can game the metrics start winning.
I have heard of stories where employees start building their own “healthy” bell curve fits that deal with the above-mentioned disadvantages. In one such case, people in internal departments started taking turns for the various performance bands such that no one person gets the same rating for consecutive years.
At the same time, I have seen “unhealthy” internal systems as well. In such systems, younger employees and employees who are serving their notice period are treated as “scapegoats” for the lower ratings.
Fitting people’s performance metrics to a normal distribution introduces a bias into the process such that everyone needs to belong to a pre-selected group. As managers fight over cut-off thresholds, top performers are often frustrated and eventually leave. What the system often ends up doing is to maximise mediocre performers and good system gamers.
Now that we have covered both the scientific flaws as well as moral issues with the bell curve performance review system, it would be unfair if we did not explore solutions.
What is the Solution?
First and foremost, we need to realise that performance review is a very subjective process as it pertains to an individual (primarily). In my opinion, trying to standardize “human” performance at an organizational level is one of the primary causes of our current woes.
A system that avoids “unhealthy” comparisons with peers and provides critical feedback aimed at the individual’s improvement would be an ideal goal. However, such a system would require a lot of trial and error and would also need to be custom built to fit a given organisation’s working culture.
Be it, top performers or poor performers, people generally want and need to be treated as individuals. People generally don’t thrive in an environment where they are treated like cattle or (worse,) “resources”!
“Wait, all this talk about science and morals is great, but why fix a system that obviously seems to be working?
I can imagine a reasonable number of today’s organisations resorting to this line of thought. While they are fully entitled to such a viewpoint, I foresee change.
This is because, like any market, the work environment market is likely to sort itself out over time. Employees are more likely to prefer work environments that value them (as individuals) more. And organisations that treat their employees better (as individuals) are more likely to create more value!
Whichever way I look at it, I do not see the bell curve performance review system in future successful organisations.
We use cookies on our website to give you the most relevant experience by remembering your preferences and repeat visits. By clicking “Accept”, you consent to the use of ALL the cookies.
This website uses cookies to improve your experience while you navigate through the website. Out of these, the cookies that are categorized as necessary are stored on your browser as they are essential for the working of basic functionalities of the website. We also use third-party cookies that help us analyze and understand how you use this website. These cookies will be stored in your browser only with your consent. You also have the option to opt-out of these cookies. But opting out of some of these cookies may affect your browsing experience.
Necessary cookies are absolutely essential for the website to function properly. These cookies ensure basic functionalities and security features of the website, anonymously.
Cookie
Duration
Description
cookielawinfo-checkbox-advertisement
1 year
Set by the GDPR Cookie Consent plugin, this cookie is used to record the user consent for the cookies in the "Advertisement" category .
cookielawinfo-checkbox-analytics
11 months
This cookie is set by GDPR Cookie Consent plugin. The cookie is used to store the user consent for the cookies in the category "Analytics".
cookielawinfo-checkbox-functional
11 months
The cookie is set by GDPR cookie consent to record the user consent for the cookies in the category "Functional".
cookielawinfo-checkbox-necessary
11 months
This cookie is set by GDPR Cookie Consent plugin. The cookies is used to store the user consent for the cookies in the category "Necessary".
cookielawinfo-checkbox-others
11 months
This cookie is set by GDPR Cookie Consent plugin. The cookie is used to store the user consent for the cookies in the category "Other.
cookielawinfo-checkbox-performance
11 months
This cookie is set by GDPR Cookie Consent plugin. The cookie is used to store the user consent for the cookies in the category "Performance".
CookieLawInfoConsent
1 year
Records the default button state of the corresponding category & the status of CCPA. It works only in coordination with the primary cookie.
viewed_cookie_policy
11 months
The cookie is set by the GDPR Cookie Consent plugin and is used to store whether or not user has consented to the use of cookies. It does not store any personal data.
Functional cookies help to perform certain functionalities like sharing the content of the website on social media platforms, collect feedbacks, and other third-party features.
Performance cookies are used to understand and analyze the key performance indexes of the website which helps in delivering a better user experience for the visitors.
Cookie
Duration
Description
_gat
1 minute
This cookie is installed by Google Universal Analytics to restrain request rate and thus limit the collection of data on high traffic sites.
Analytical cookies are used to understand how visitors interact with the website. These cookies help provide information on metrics the number of visitors, bounce rate, traffic source, etc.
Cookie
Duration
Description
__gads
1 year 24 days
The __gads cookie, set by Google, is stored under DoubleClick domain and tracks the number of times users see an advert, measures the success of the campaign and calculates its revenue. This cookie can only be read from the domain they are set on and will not track any data while browsing through other sites.
_ga
2 years
The _ga cookie, installed by Google Analytics, calculates visitor, session and campaign data and also keeps track of site usage for the site's analytics report. The cookie stores information anonymously and assigns a randomly generated number to recognize unique visitors.
_ga_R5WSNS3HKS
2 years
This cookie is installed by Google Analytics.
_gat_gtag_UA_131795354_1
1 minute
Set by Google to distinguish users.
_gid
1 day
Installed by Google Analytics, _gid cookie stores information on how visitors use a website, while also creating an analytics report of the website's performance. Some of the data that are collected include the number of visitors, their source, and the pages they visit anonymously.
CONSENT
2 years
YouTube sets this cookie via embedded youtube-videos and registers anonymous statistical data.
Advertisement cookies are used to provide visitors with relevant ads and marketing campaigns. These cookies track visitors across websites and collect information to provide customized ads.
Cookie
Duration
Description
IDE
1 year 24 days
Google DoubleClick IDE cookies are used to store information about how the user uses the website to present them with relevant ads and according to the user profile.
test_cookie
15 minutes
The test_cookie is set by doubleclick.net and is used to determine if the user's browser supports cookies.
VISITOR_INFO1_LIVE
5 months 27 days
A cookie set by YouTube to measure bandwidth that determines whether the user gets the new or old player interface.
YSC
session
YSC cookie is set by Youtube and is used to track the views of embedded videos on Youtube pages.
yt-remote-connected-devices
never
YouTube sets this cookie to store the video preferences of the user using embedded YouTube video.
yt-remote-device-id
never
YouTube sets this cookie to store the video preferences of the user using embedded YouTube video.

Comments